
10th Maths 14.2
Chapter 14
Statistics
NCERT Class 10th solution of Exercise 14.1
Exercise 14.2
Q1. The following table shows the ages of the patients admitted in a hospital during a year.
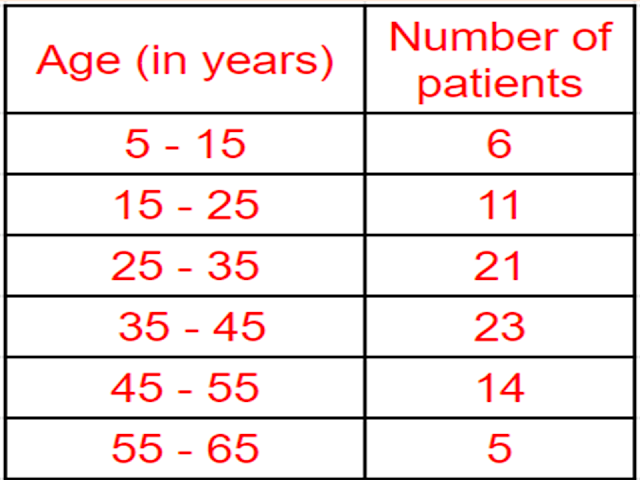
Find the mode and the mean of the data given above. Compare and interpret the two measures of central tendency.
Sol. :
`text{For Mode}`
`text{maximum class frequency is 23}`
`text{modal class = 35—45}`
`text{lower limit l = 35}`
`text{class size h = 10}`
`text{frequency of modal class}` `f_1 = 23`
`text{frequency just before modal class}` `f_0 = 21`
`text{frequency just after modal class}` `f_2 = 14`
`text{Mode Z}` `= l + ((f_1 - f_0)/(2f_1-f_0-f_2))``times text{ h}`
`text{Mode Z}` `= 35 + ((23 - 21)/(2 times 23 - 21 - 14)) times 10`
`text{Mode Z}` `= 35 + ((2)/(46-35)) times 10`
`text{Mode Z}` `= 35 + (20)/(11)`
`text{Mode Z}` `= 35 + 1.82`
`text{Mode Z}` `= 36.82`
`text{For Mean}`

`text{Mean } overline x = (sum f_i x_i)/(sum f_i)`
`overline x = 2590/76`
`overline x = 34.08`
`text{Answer:}`
`text{Mode = 36.82 years, Mean = 34.08 years}.`
Q2. The following data gives the information on the observed lifetimes (in hours) of `225` electrical components:

Determine the modal lifetimes of the components.
Sol. :
`text{For Mode}`
`text{maximum class frequency is 61}`
`text{modal class = 60—80}`
`text{lower limit l = 60}`
`text{class size h = 20}`
`text{frequency of modal class}` `f_1 = 61`
`text{frequency just before modal class}` `f_0 = 52`
`text{frequency just after modal class}` `f_2 = 38`
`text{Mode Z}` `= l + ((f_1 - f_0)/(2f_1-f_0-f_2))``times text{ h}`
`text{Mode Z}` `= 60 + ((61 - 52)/(2 times 61 - 52 - 38)) times 20`
`text{Mode Z}` `= 60 + ((9)/(122-90)) times 20`
`text{Mode Z}` `= 60 + (180)/(32)`
`text{Mode Z}` `= 60 + 5.63`
`text{Mode Z}` `= 65.63`
`text{Answer:}`
`text{Mode = 65.625 hours.}`
Q3. The following data gives the distribution of total monthly household expenditure of `200` families of a village. Find the modal monthly expenditure of the families. Also, find the mean monthly expenditure:

Sol. :
`text{For Mode}`
`text{maximum class frequency is 40}`
`text{modal class = 1500—2000}`
`text{lower limit l = 1500}`
`text{class size h = 500}`
`text{frequency of modal class}` `f_1 = 40`
`text{frequency just before modal class}` `f_0 = 24`
`text{frequency just after modal class}` `f_2 = 33`
`text{Mode Z}` `= l + ((f_1 - f_0)/(2f_1-f_0-f_2))``times text{ h}`
`text{Mode Z}` `= 1500 + ((40 - 24)/(2 times 40 - 24 - 33)) times 500`
`text{Mode Z}` `= 1500 + ((16)/(80-57)) times 500`
`text{Mode Z}` `= 1500 + (8000)/(23)`
`text{Mode Z}` `= 1500 + 347.83`
`text{Mode Z}` `= ₹ 1847.83`
`text{For Mean}`

`text{Assume mean a = 2750 and h = 3000 - 2500 = 500}`
`text{Mean }``overlinex = a + ((sumf_iu_i)/(sumf_i)) times``text{h}`
`overline x = 2750 + (-35times500)/200`
`overline x = 2750 - (175)/2`
`overline x = 2750 -87.50`
`overline x = text{₹ 2662.50}`
`text{Answer:}`
`text{Modal monthly expenditure = ₹ 1847.83},`
`text{Mean monthly expenditure = ₹ 2662.5.}`
Q4. The following distribution gives the state-wise teacher-student ratio in higher secondary schools of India. Find the mode and mean of this data. Interpret the two measures.

Sol. :
`text{For Mode}`
`text{maximum class frequency is 10}`
`text{modal class = 30—35}`
`text{lower limit l = 30}`
`text{class size h = 5}`
`text{frequency of modal class}` `f_1 = 10`
`text{frequency just before modal class}` `f_0 = 9`
`text{frequency just after modal class}` `f_2 = 3`
`text{Mode Z}` `= l + ((f_1 - f_0)/(2f_1-f_0-f_2))``times text{ h}`
`text{Mode Z}` `= 30 + ((10 - 9)/(2 times 10 - 9 - 3)) times 5`
`text{Mode Z}` `= 30 + ((1)/(20-12)) times 5`
`text{Mode Z}` `= 30 + (5)/(8)`
`text{Mode Z}` `= 30 + 0.625`
`text{Mode Z}` `= 30.625`
`text{For Mean}`

`text{Assume mean a =32.5 and h = 35 - 30 = 5}`
`text{Mean }``overlinex = a + ((sumf_iu_i)/(sumf_i)) times``text{h}`
`overline x = 32.5 + (-23times5)/35`
`overline x = 32.5 - 3.3`
`overline x = 29.2``text ( approx.)`
`text{Answer:}`
`text{Mode = 30.6, Mean = 29.2.}`
Q5. The given distribution shows the number of runs scored by some top batsmen of the world in one-day international cricket matches.

Find the mode of the data.
Sol. :
`text{For Mode}`
`text{maximum class frequency is 18}`
`text{modal class = 4000—5000}`
`text{lower limit l = 4000}`
`text{class size h = 1000}`
`text{frequency of modal class}` `f_1 = 18`
`text{frequency just before modal class}` `f_0 = 4`
`text{frequency just after modal class}` `f_2 = 9`
`text{Mode Z}` `= l + ((f_1 - f_0)/(2f_1-f_0-f_2))``times text{ h}`
`text{Mode Z}` `= 4000 + ((18 - 4)/(2 times 18 - 4 - 9)) times 1000`
`text{Mode Z}` `= 4000 + ((14)/(36-13)) times 1000`
`text{Mode Z}` `= 4000 + (14000)/(23)`
`text{Mode Z}` `= 4000 + 608.7`
`text{Mode Z}` `= 4608.7`
`text{Answer:}`
`text{Mode = 4608.7 runs.}`
Q6. A student noted the number of cars passing through a spot on a road for `100` periods each of `3` minutes and summarised it in the table given below. Find the mode of the data:

Sol. :
`text{For Mdoe}`
`text{maximum class frequency is 20}`
`text{modal class = 40—50}`
`text{lower limit l = 40}`
`text{class size h = 10}`
`text{frequency of modal class}` `f_1 = 20`
`text{frequency just before modal class}` `f_0 = 12`
`text{frequency just after modal class}` `f_2 = 11`
`text{Mode Z}` `= l + ((f_1 - f_0)/(2f_1-f_0-f_2))``times text{ h}`
`text{Mode Z}` `= 40 + ((20 - 12)/(2 times 20 - 12 - 11)) times 10`
`text{Mode Z}` `= 40 + ((8)/(40-23)) times 10`
`text{Mode Z}` `= 40 + (80)/(17)`
`text{Mode Z}` `= 40 + 4.71`
`text{Mode Z}` `= 44.71`
`text{Answer:}`
`text{Mode = 44.7 car}`


Comments